Learn from the topMicrosoft 365CopilotSharePointMicrosoft TeamsTeams DevelopmentTeams Architecture & AdministrationPower BIPower AutomatePower AppsCopilot StudioPower PagesAzureOneDriveSearchContent ManagementBusiness ValueImplementation/AdministrationWorkflowBusiness IntelligenceSharePoint DevelopmentSharePoint Premiumexperts!

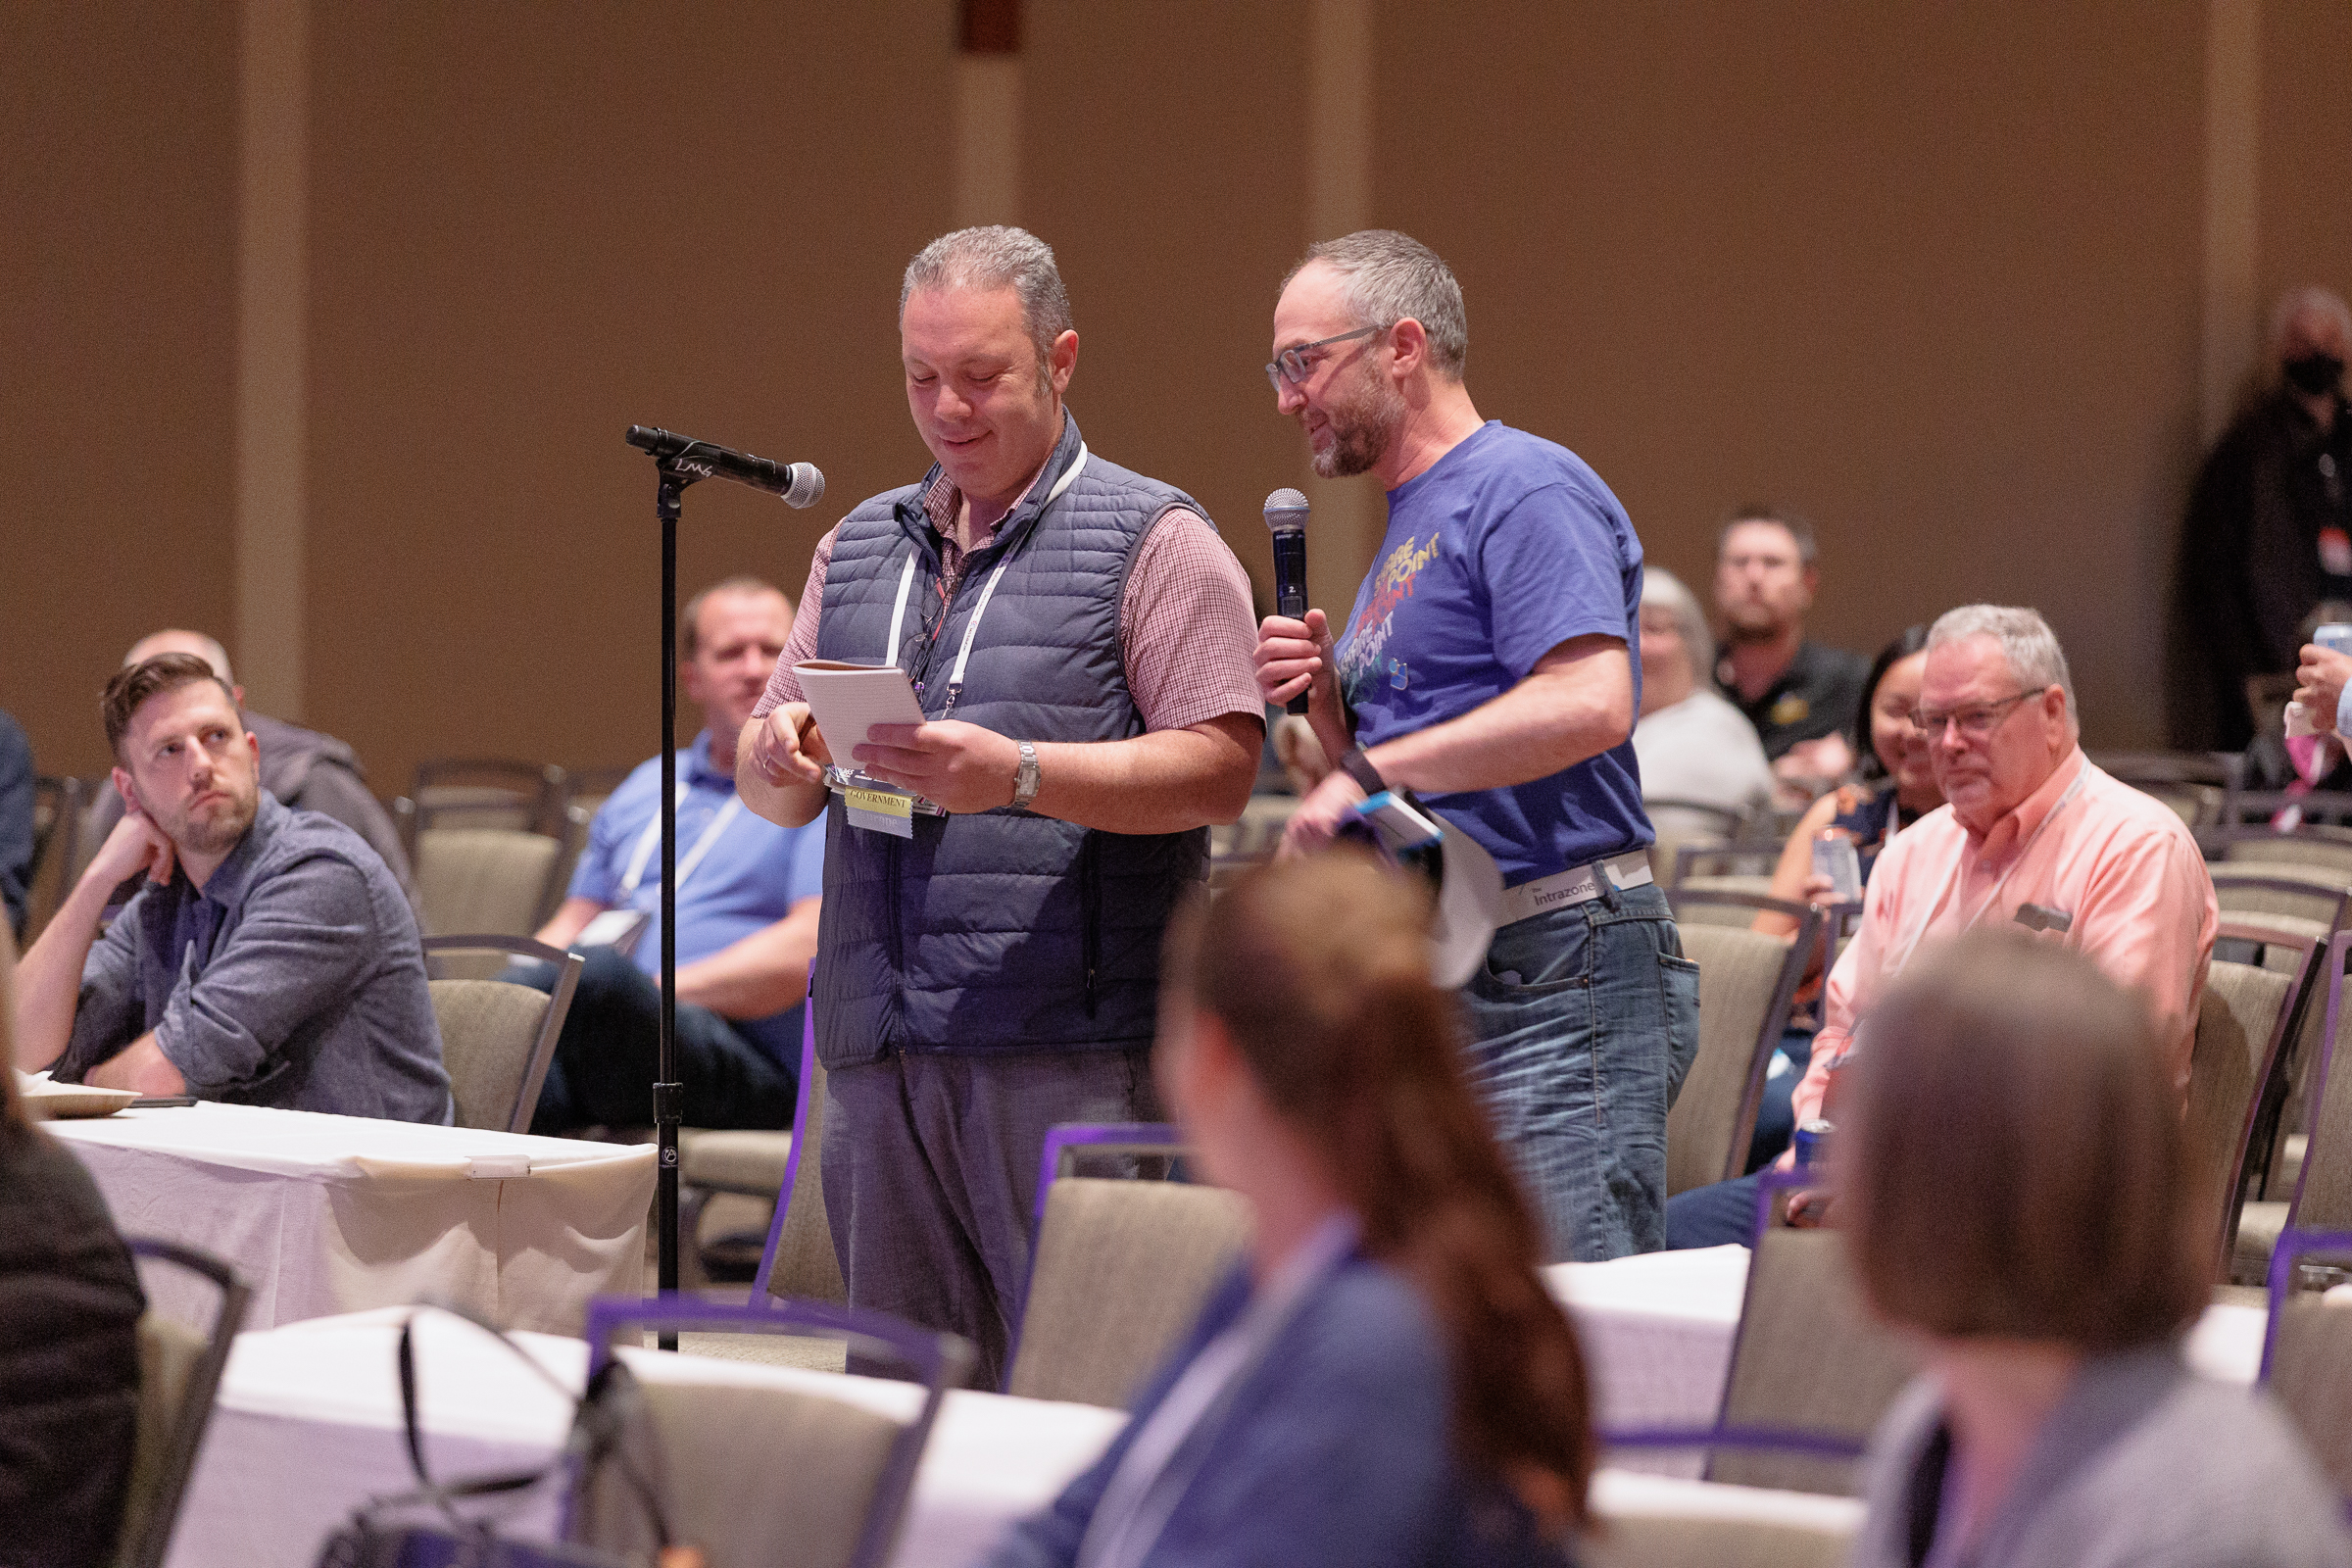
SESSIONS FOR ALL LEVELS
With 2 optional days of workshops and a 3-day conference, you can choose from over 130 sessions in multiple tracks and 25 workshops presented by Microsoft 365, SharePoint, Power Platform, Microsoft Teams, Viva, Azure, Copilot & AI's top experts!

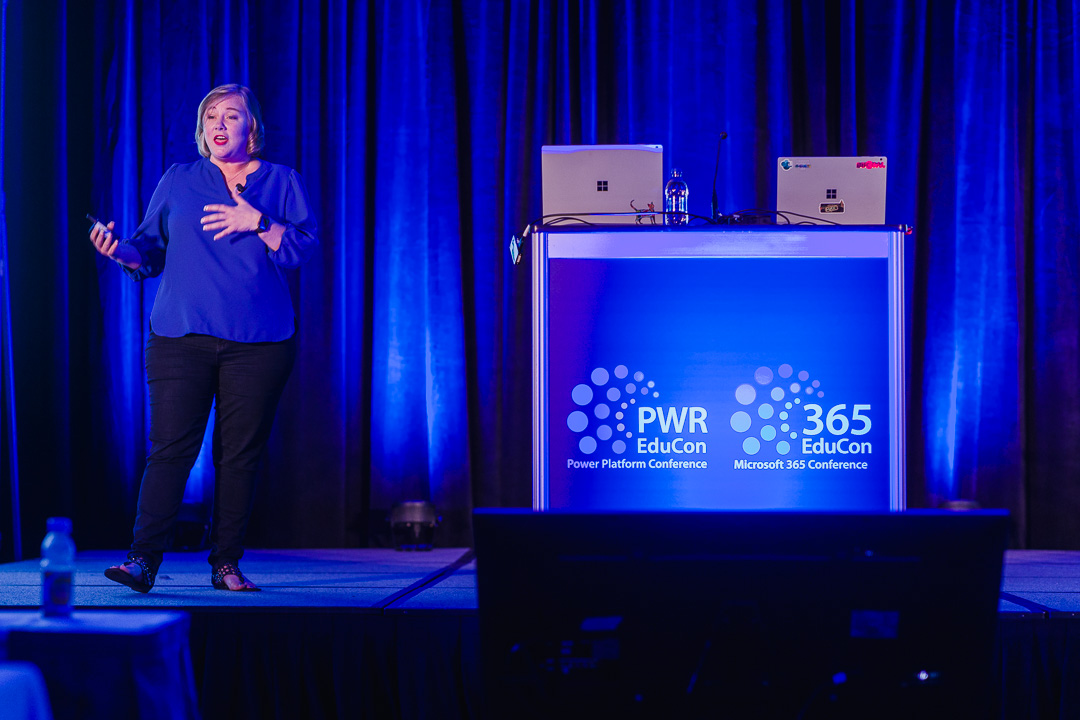
LEARN FROM THE EXPERTS
Many of our speakers are Microsoft MVPs, MCMs, Microsoft Program Managers, Microsoft Engineers, MCTs or Microsoft Regional Directors, based on their in-depth knowledge of Microsoft 365, SharePoint, Power Platform, Azure, Copilot, AI and more!

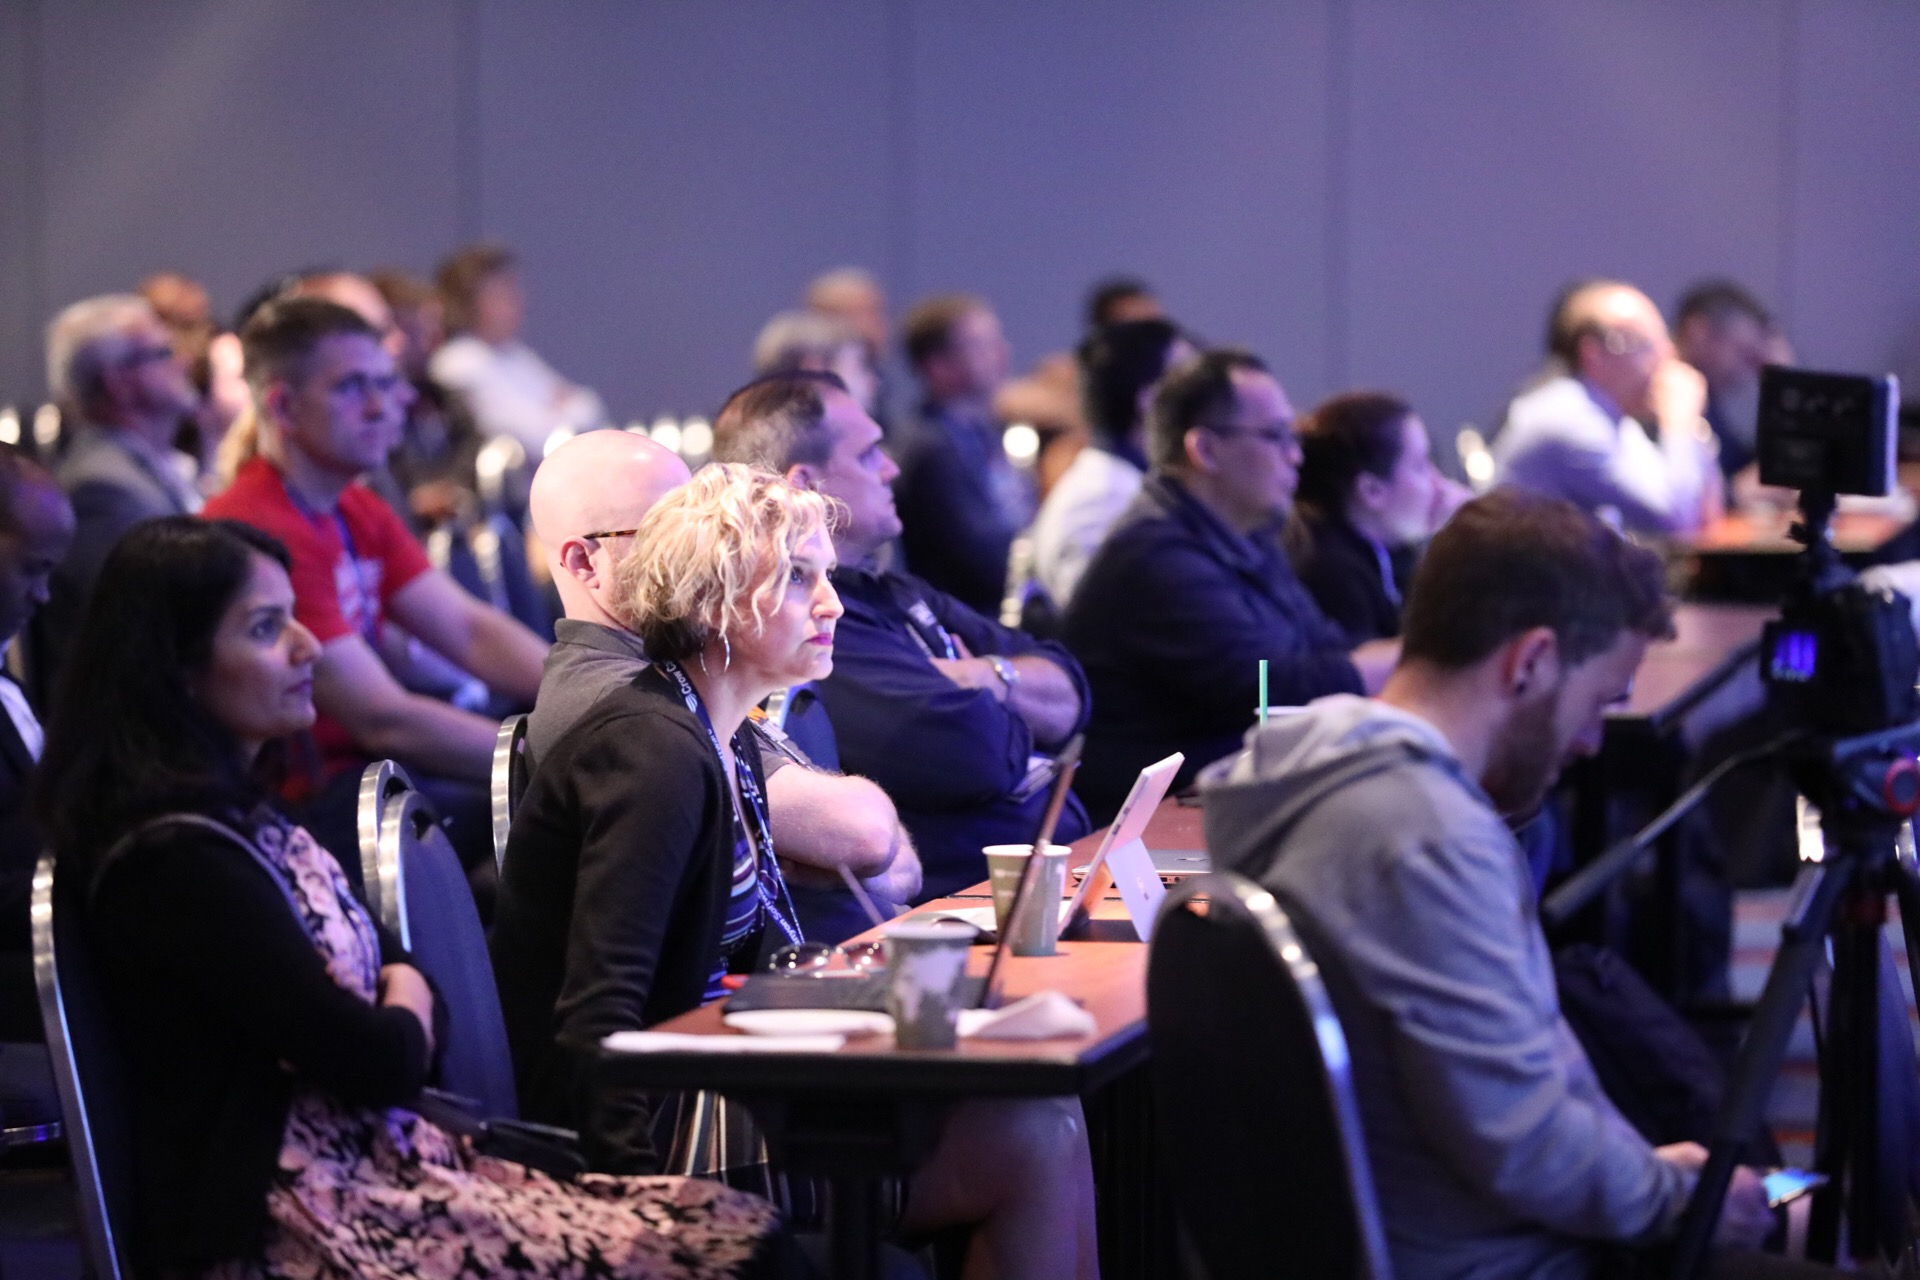
CONNECT AND CULTIVATE
See how the Microsoft 365, SharePoint Power Platform, Azure, and AI ecosystem is growing and evolving by speaking with technical experts from the local Microsoft field and diverse channels within the Microsoft Partner Network - all in our exhibit hall.
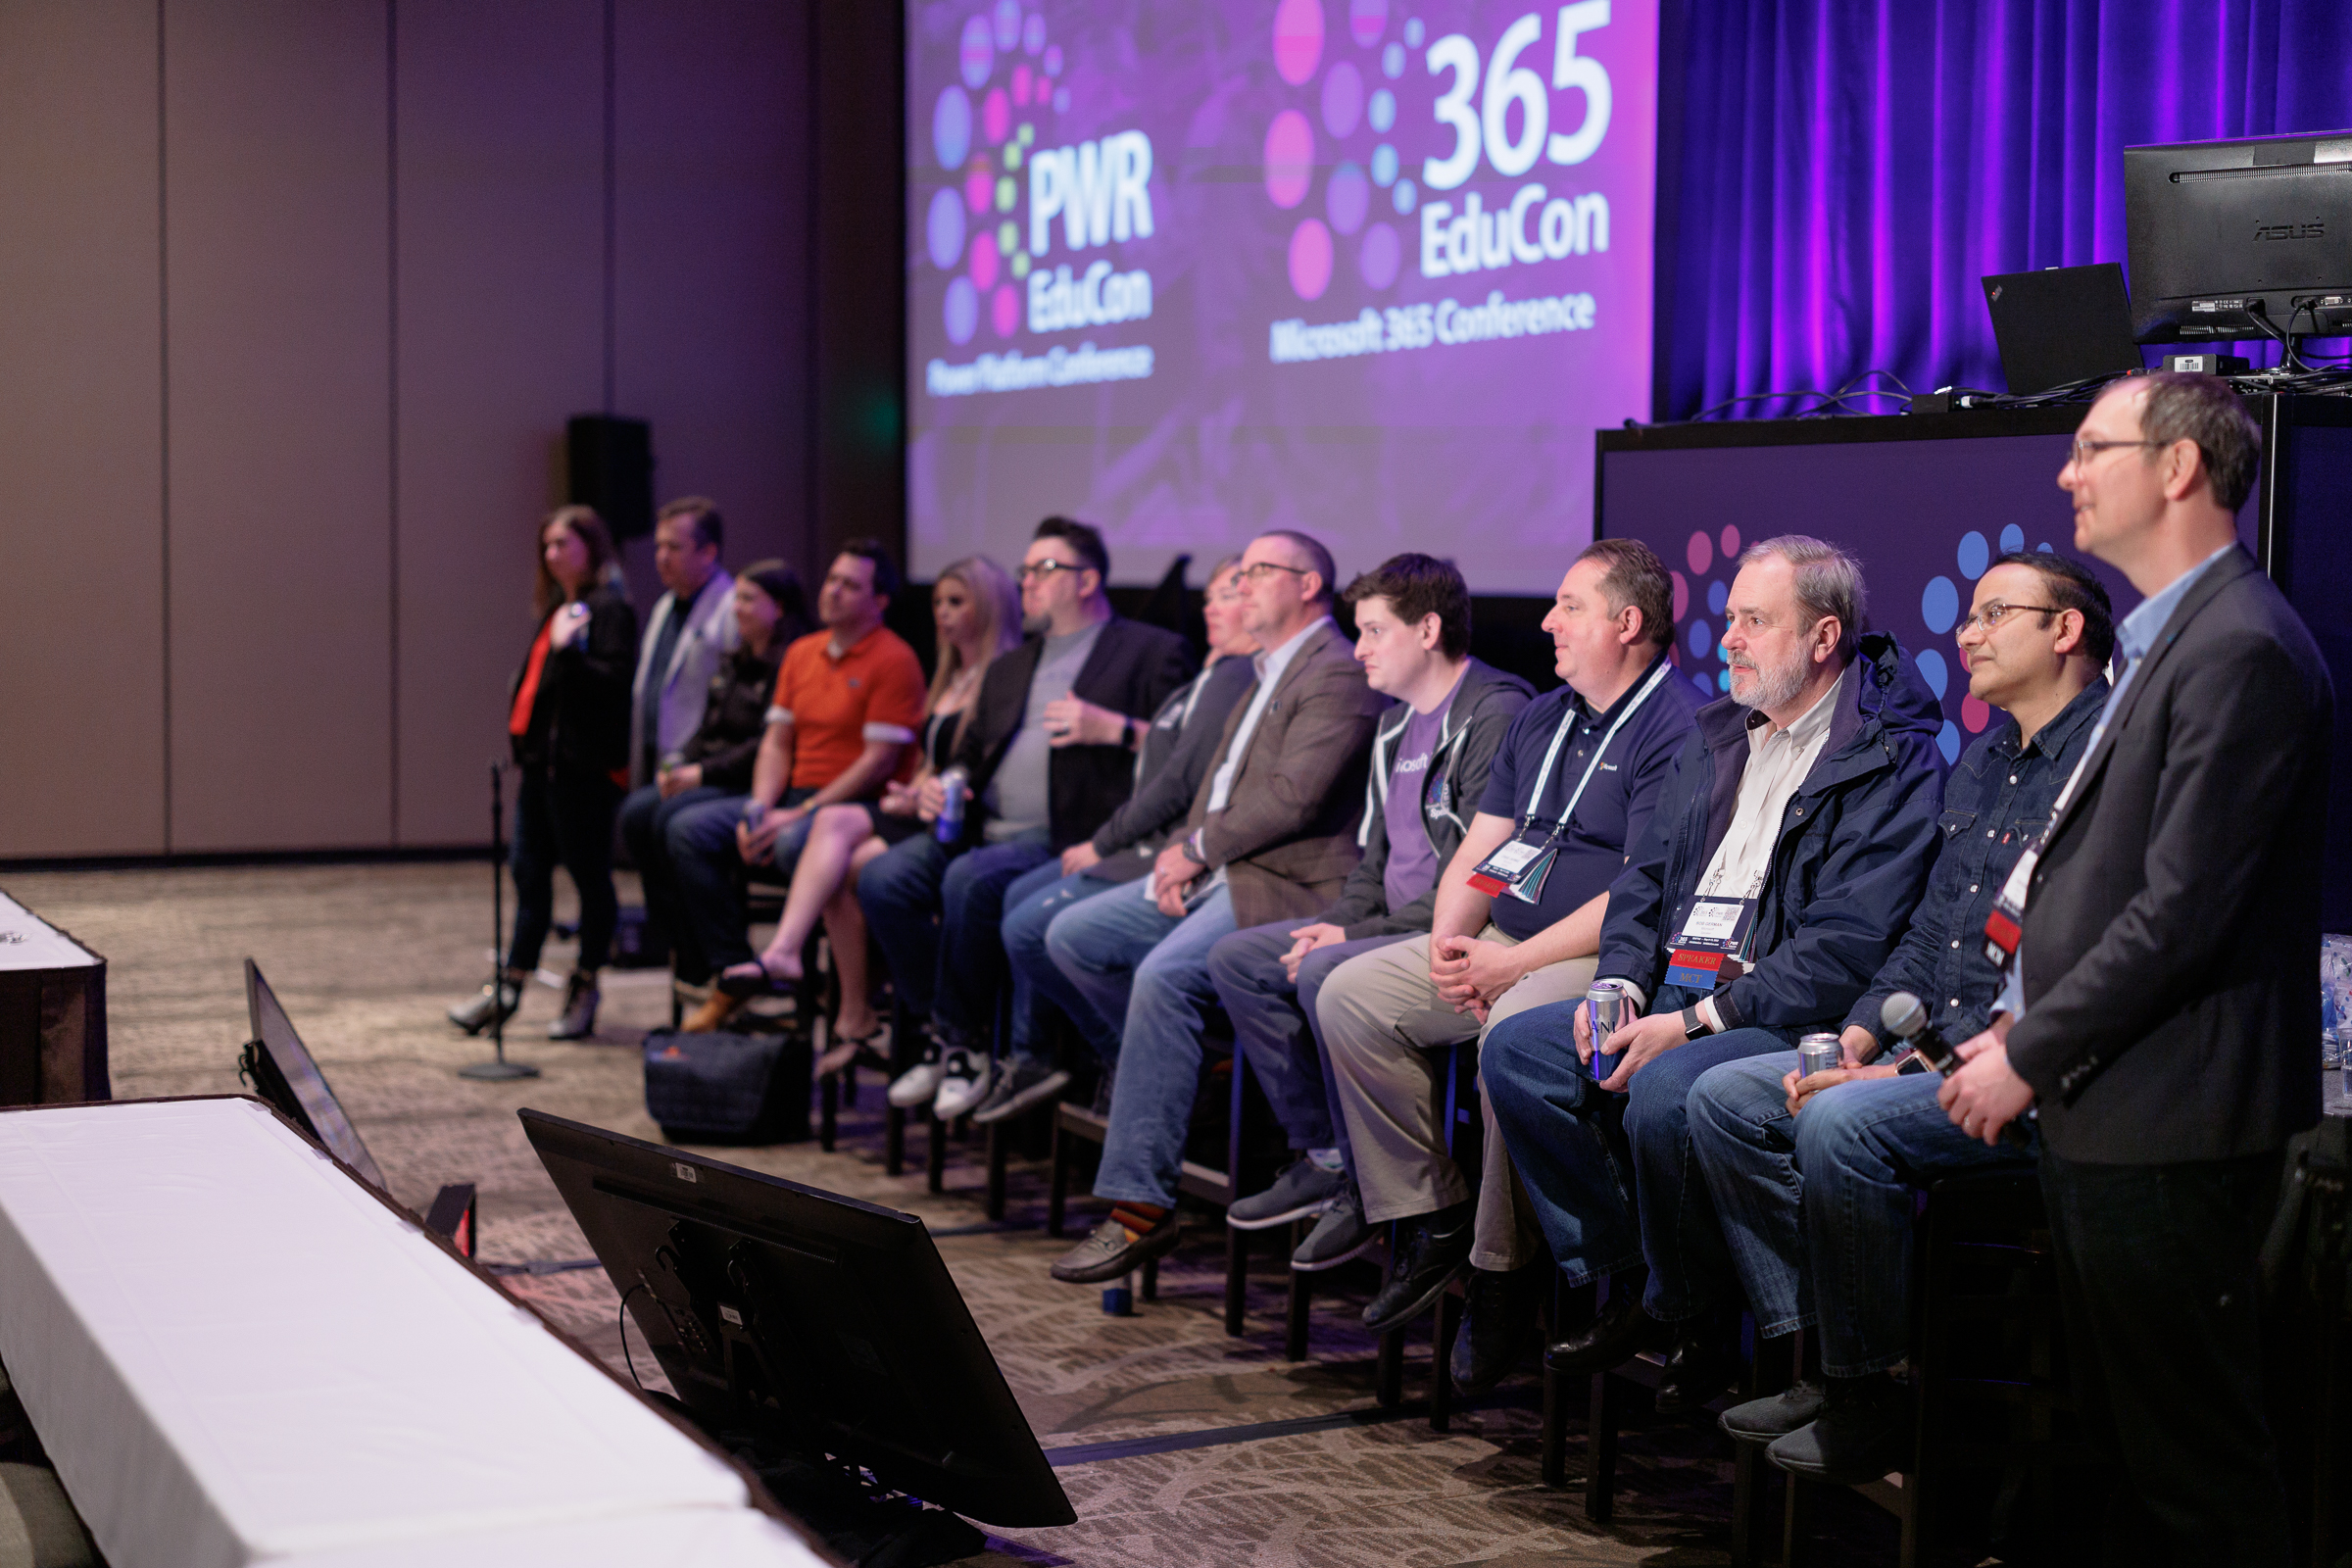
LEARN FROM THE TOP EXPERTS IN MICROSOFT 365, POWER PLATFORM, AZURE & AI
ABOUT TechCon 365 Dallas
Microsoft TechCon 365, is a Microsoft 365 and Power Platform Training Conference that brings you the world’s leading experts in Microsoft 365, Power Platform, Azure, & AI. Whether you are new to Microsoft 365 and Power Platform or an experienced power user, admin, or developer, TechCon 365 has content designed to fit your experience level and area of interest. Our workshops and sessions are taught by Microsoft Certified Trainers, Microsoft MVPs, Microsoft Regional Directors and Microsoft product group members.
At Microsoft TechCon 365, the sessions are offered for the following subjects: Microsoft 365, Copilot, Microsoft Teams, Teams Development, Teams Architecture & Administration, Microsoft Fabric, Dataverse, Syntex/SharePoint Premium, Power BI, Power Automate, Power Apps, Power Virtual Agents, Power Pages, SharePoint Administration & Development, Azure OpenAI, OneDrive, Purview, Loop, Search, Content Management, Power Users, Business Value, Implementation/Administration, Workflow, Business Intelligence, and more. Choose one complete learning track or mix and match based on what content best meets you and your organization’s current needs!